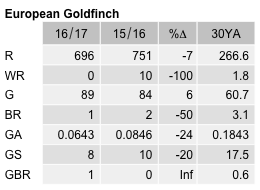
European Goldfinch
Carduelis carduelis
ABR description
The following is extracted from the Annual Bird Report for the twelve months to June 2017.
Common, breeding resident
An introduced species found in suitable terrain (paddocks with seedy weeds) in the region.
General: While the number of records is down on last year, the number of birds seen is up 10%. The reporting rate is low, 22% down on last year and 33% down on the 10YA and 49% down on the 30YA. The abundance is down 9% on last year and a little below 10 & 30YAs. More observations in summer (41%) and spring (25%) than in autumn (19%) and winter (15%). Mean 8.1, median 2, with max 346/25 Jun JWNR (SmA1). 2 breeding records: earliest, dy/31 Jan JWNR (HeS1) and latest br/6 Feb Murrumbateman (CnM1).
GBS: 64 records from 8 sites (14%), in 44 weeks in such places as Giralang, Crace, Curtin and Lyneham. A single breeding record: dy/3wk Jan Bonner (GrB1).
Abundance
Abundance is the average number of birds of that species per survey. Where the species was observed (presence recorded) but the number of birds seen was not recorded, this is treated as a count of zero.
Abundance by year
This chart shows the abundance of European Goldfinch between 1982 and 2017. 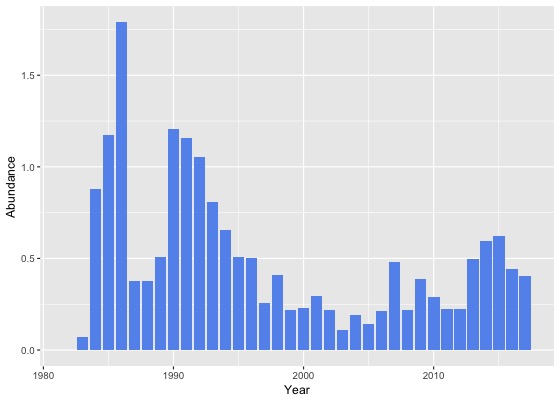
Abundance by month
This chart shows the monthly abundance of European Goldfinch. The blue lines show the abundance for the twelve months to June 2017 and the bars show the average abundance for the period 1982 to 2017. 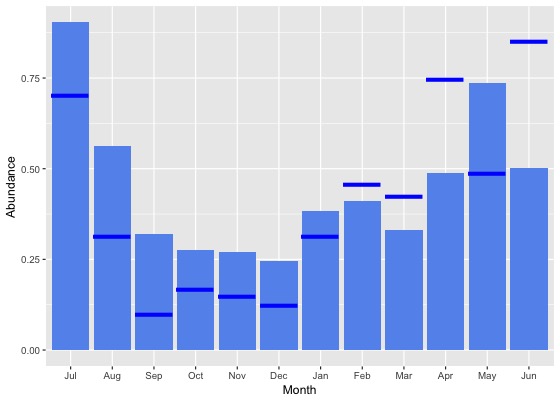
Abundance by season
This chart shows the seasonal abundance of European Goldfinch. The blue lines show the seasonal abundance for the twelve months to June 2017 and the bars show the average seasonal abundance for the period 1982 to 2017. 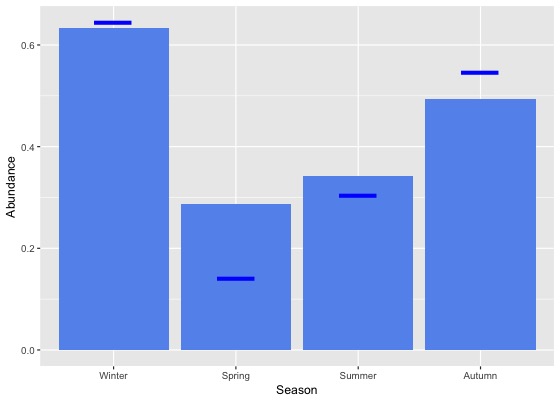
Abundance data
| Month | Season | ||||||||||||||||||
|---|---|---|---|---|---|---|---|---|---|---|---|---|---|---|---|---|---|---|---|
| Period | Jul | Aug | Sep | Oct | Nov | Dec | Jan | Feb | Mar | Apr | May | Jun | Winter | Spring | Summer | Autumn | All | ||
| All years | |||||||||||||||||||
| All | 0.9 | 0.6 | 0.3 | 0.3 | 0.3 | 0.2 | 0.4 | 0.4 | 0.3 | 0.5 | 0.7 | 0.5 | 0.6 | 0.3 | 0.3 | 0.5 | 0.4 | ||
| Previous years | |||||||||||||||||||
| All previous years | 0.9 | 0.6 | 0.4 | 0.3 | 0.3 | 0.3 | 0.4 | 0.4 | 0.3 | 0.4 | 0.8 | 0.4 | 0.6 | 0.3 | 0.3 | 0.5 | 0.4 | ||
| Previous 30 years | 0.9 | 0.6 | 0.3 | 0.3 | 0.3 | 0.2 | 0.4 | 0.4 | 0.3 | 0.4 | 0.8 | 0.4 | 0.6 | 0.3 | 0.3 | 0.5 | 0.4 | ||
| Previous 20 years | 1.0 | 0.6 | 0.3 | 0.2 | 0.2 | 0.2 | 0.3 | 0.3 | 0.3 | 0.4 | 0.7 | 0.4 | 0.6 | 0.2 | 0.3 | 0.4 | 0.4 | ||
| 10 year groups | |||||||||||||||||||
| [2007,2017) | 1.4 | 0.6 | 0.3 | 0.2 | 0.3 | 0.2 | 0.4 | 0.3 | 0.3 | 0.5 | 1.0 | 0.5 | 0.8 | 0.3 | 0.3 | 0.5 | 0.4 | ||
| [1997,2007) | 0.4 | 0.4 | 0.2 | 0.2 | 0.1 | 0.1 | 0.3 | 0.2 | 0.2 | 0.3 | 0.2 | 0.1 | 0.3 | 0.2 | 0.2 | 0.2 | 0.2 | ||
| [1987,1997) | 0.7 | 0.7 | 0.6 | 0.6 | 0.5 | 0.5 | 0.7 | 0.7 | 0.4 | 0.6 | 0.9 | 0.7 | 0.7 | 0.5 | 0.6 | 0.6 | 0.6 | ||
| 5 year groups | |||||||||||||||||||
| [2012,2017) | 1.7 | 0.7 | 0.3 | 0.2 | 0.2 | 0.3 | 0.4 | 0.4 | 0.4 | 0.5 | 1.1 | 0.5 | 0.9 | 0.3 | 0.3 | 0.6 | 0.5 | ||
| [2007,2012) | 0.5 | 0.5 | 0.4 | 0.2 | 0.3 | 0.1 | 0.3 | 0.3 | 0.2 | 0.3 | 0.6 | 0.4 | 0.5 | 0.3 | 0.2 | 0.3 | 0.3 | ||
| [2002,2007) | 0.4 | 0.3 | 0.1 | 0.2 | 0.1 | 0.1 | 0.3 | 0.2 | 0.1 | 0.2 | 0.2 | 0.1 | 0.2 | 0.1 | 0.2 | 0.2 | 0.2 | ||
| [1997,2002) | 0.4 | 0.5 | 0.3 | 0.2 | 0.2 | 0.2 | 0.3 | 0.3 | 0.2 | 0.3 | 0.2 | 0.1 | 0.3 | 0.2 | 0.2 | 0.3 | 0.3 | ||
| [1992,1997) | 1.2 | 0.7 | 0.8 | 0.7 | 0.6 | 0.4 | 0.8 | 0.7 | 0.3 | 0.6 | 0.8 | 0.6 | 0.8 | 0.7 | 0.6 | 0.6 | 0.7 | ||
| [1987,1992) | 0.4 | 0.7 | 0.5 | 0.5 | 0.4 | 0.6 | 0.6 | 0.7 | 0.5 | 0.6 | 1.0 | 0.8 | 0.6 | 0.5 | 0.6 | 0.7 | 0.6 | ||
| Year | |||||||||||||||||||
| 2017 | 0.7 | 0.3 | 0.1 | 0.2 | 0.1 | 0.1 | 0.3 | 0.5 | 0.4 | 0.7 | 0.5 | 0.9 | 0.6 | 0.1 | 0.3 | 0.5 | 0.4 | ||
| 2016 | 1.3 | 0.6 | 0.3 | 0.2 | 0.2 | 0.2 | 0.3 | 0.3 | 0.5 | 0.4 | 1.0 | 0.4 | 0.7 | 0.2 | 0.3 | 0.6 | 0.4 | ||
| 2015 | 3.5 | 1.1 | 0.3 | 0.2 | 0.2 | 0.3 | 0.3 | 0.3 | 0.4 | 0.8 | 0.8 | 0.7 | 1.6 | 0.3 | 0.3 | 0.7 | 0.6 | ||
| 2014 | 1.6 | 0.6 | 0.2 | 0.3 | 0.4 | 0.4 | 0.5 | 0.5 | 0.5 | 0.5 | 2.7 | 0.5 | 0.7 | 0.3 | 0.5 | 1.0 | 0.6 | ||
| 2013 | 0.8 | 0.5 | 0.5 | 0.3 | 0.3 | 0.6 | 0.4 | 0.5 | 0.4 | 0.6 | 0.8 | 0.7 | 0.7 | 0.3 | 0.5 | 0.6 | 0.5 | ||
| 2012 | 0.6 | 0.3 | 0.1 | 0.2 | 0.2 | 0.1 | 0.2 | 0.3 | 0.1 | 0.1 | 0.3 | 0.3 | 0.4 | 0.2 | 0.2 | 0.2 | 0.2 | ||
| 2011 | 0.2 | 0.1 | 0.4 | 0.2 | 0.4 | 0.0 | 0.3 | 0.4 | 0.1 | 0.4 | 0.3 | 0.1 | 0.1 | 0.3 | 0.2 | 0.3 | 0.2 | ||
| 2010 | 0.7 | 0.4 | 0.8 | 0.3 | 0.2 | 0.2 | 0.4 | 0.1 | 0.1 | 0.2 | 0.2 | 0.0 | 0.2 | 0.4 | 0.3 | 0.2 | 0.3 | ||
| 2009 | 0.9 | 2.1 | 0.7 | 0.1 | 0.3 | 0.1 | 0.4 | 0.3 | 0.3 | 0.4 | 0.3 | 0.1 | 0.8 | 0.3 | 0.2 | 0.4 | 0.4 | ||
| 2008 | 0.1 | 0.2 | 0.1 | 0.2 | 0.3 | 0.0 | 0.4 | 0.2 | 0.1 | 0.1 | 0.1 | 0.9 | 0.5 | 0.2 | 0.2 | 0.1 | 0.2 | ||
| 2007 | 0.7 | 0.1 | 0.1 | 0.4 | 0.6 | 0.0 | 0.3 | 0.3 | 0.2 | 0.6 | 2.4 | 1.0 | 0.7 | 0.3 | 0.2 | 0.8 | 0.5 | ||
| 2006 | 0.2 | 0.3 | 0.0 | 0.1 | 0.0 | 0.1 | 0.5 | 0.2 | 0.3 | 0.1 | 0.6 | 0.2 | 0.2 | 0.1 | 0.3 | 0.3 | 0.2 | ||
| 2005 | 0.1 | 0.2 | 0.1 | 0.2 | 0.2 | 0.1 | 0.1 | 0.2 | 0.2 | 0.2 | 0.1 | 0.2 | 0.2 | 0.1 | 0.1 | 0.2 | 0.1 | ||
| 2004 | 0.6 | 0.1 | 0.2 | 0.2 | 0.1 | 0.1 | 0.2 | 0.3 | 0.0 | 0.1 | 0.1 | 0.2 | 0.3 | 0.2 | 0.2 | 0.1 | 0.2 | ||
| 2003 | 0.5 | 0.1 | 0.2 | 0.1 | 0.1 | 0.1 | 0.1 | 0.1 | 0.0 | 0.2 | 0.1 | 0.0 | 0.1 | 0.1 | 0.1 | 0.1 | 0.1 | ||
| 2002 | 0.3 | 0.9 | 0.1 | 0.2 | 0.3 | 0.1 | 0.3 | 0.2 | 0.0 | 0.5 | 0.2 | 0.0 | 0.3 | 0.2 | 0.2 | 0.2 | 0.2 | ||
| 2001 | 0.2 | 0.4 | 0.3 | 0.4 | 0.2 | 0.2 | 0.4 | 0.2 | 0.3 | 0.7 | 0.1 | 0.1 | 0.2 | 0.3 | 0.3 | 0.4 | 0.3 | ||
| 2000 | 0.9 | 0.2 | 0.1 | 0.1 | 0.2 | 0.1 | 0.4 | 0.2 | 0.3 | 0.2 | 0.2 | 0.2 | 0.4 | 0.1 | 0.2 | 0.3 | 0.2 | ||
| 1999 | 1.1 | 0.3 | 0.2 | 0.3 | 0.1 | 0.2 | 0.1 | 0.2 | 0.1 | 0.2 | 0.3 | 0.1 | 0.3 | 0.2 | 0.2 | 0.2 | 0.2 | ||
| 1998 | 0.0 | 2.5 | 0.7 | 0.3 | 0.1 | 0.1 | 0.4 | 0.7 | 0.1 | 0.3 | 0.0 | 0.0 | 0.8 | 0.4 | 0.4 | 0.1 | 0.4 | ||
| 1997 | 0.2 | 0.1 | 0.4 | 0.2 | 0.2 | 0.3 | 0.4 | 0.4 | 0.2 | 0.2 | 0.2 | 0.0 | 0.1 | 0.3 | 0.4 | 0.2 | 0.3 | ||
| 1996 | 1.8 | 0.3 | 0.0 | 0.1 | 0.2 | 0.2 | 0.4 | 0.4 | 0.1 | 1.3 | 0.5 | 1.3 | 1.1 | 0.1 | 0.3 | 0.6 | 0.5 | ||
| 1995 | 0.7 | 0.1 | 0.3 | 0.5 | 0.9 | 0.3 | 0.8 | 0.6 | 0.3 | 0.3 | 0.9 | 0.4 | 0.4 | 0.6 | 0.6 | 0.5 | 0.5 | ||
| 1994 | 0.2 | 1.3 | 1.8 | 0.7 | 0.6 | 0.5 | 0.6 | 1.0 | 0.2 | 0.4 | 0.3 | 0.6 | 0.7 | 0.9 | 0.7 | 0.3 | 0.7 | ||
| 1993 | 0.4 | 1.4 | 0.1 | 0.5 | 1.2 | 0.6 | 1.3 | 0.7 | 0.5 | 0.7 | 1.7 | 0.2 | 0.7 | 0.6 | 0.9 | 1.0 | 0.8 | ||
| 1992 | 2.6 | 0.9 | 1.7 | 1.9 | 0.5 | 0.7 | 1.2 | 0.9 | 0.4 | 0.7 | 0.5 | 0.1 | 1.2 | 1.4 | 0.9 | 0.5 | 1.1 | ||
| 1991 | 0.4 | 0.9 | 0.9 | 1.2 | 1.2 | 1.1 | 1.5 | 0.7 | 1.1 | 1.1 | 2.0 | 3.1 | 1.1 | 1.1 | 1.1 | 1.4 | 1.2 | ||
| 1990 | 0.4 | 0.6 | 0.5 | 0.2 | 0.2 | 0.6 | 1.6 | 2.5 | 1.7 | 1.8 | 4.9 | 2.0 | 0.8 | 0.3 | 1.5 | 2.7 | 1.2 | ||
| 1989 | 0.3 | 1.0 | 0.4 | 0.6 | 0.3 | 0.5 | 0.4 | 0.5 | 0.3 | 0.5 | 0.5 | 0.5 | 0.7 | 0.4 | 0.5 | 0.5 | 0.5 | ||
| 1988 | 0.2 | 0.4 | 0.4 | 0.5 | 0.3 | 0.6 | 0.3 | 0.5 | 0.2 | 0.4 | 0.3 | 0.3 | 0.3 | 0.4 | 0.4 | 0.3 | 0.4 | ||
| 1987 | 5.2 | 0.2 | 0.3 | 0.5 | 0.3 | 0.5 | 0.4 | 0.4 | 0.2 | 0.2 | 0.3 | 0.4 | 0.6 | 0.4 | 0.4 | 0.2 | 0.4 | ||
| 1986 | 0.3 | 2.3 | 2.4 | 2.4 | 1.3 | 1.9 | 1.6 | 2.8 | 0.5 | 1.6 | 1.7 | 1.9 | 1.6 | 2.0 | 2.2 | 1.3 | 1.8 | ||
| 1985 | 1.4 | 1.2 | 0.9 | 1.2 | 0.8 | 1.4 | 0.4 | 3.0 | 0.0 | 0.5 | 2.0 | 1.1 | 1.2 | 1.0 | 1.6 | 0.8 | 1.2 | ||
| 1984 | 0.0 | 0.0 | 0.0 | 0.0 | 0.0 | 0.0 | 2.3 | 0.6 | 1.0 | 0.6 | 2.1 | 0.2 | 0.1 | 0.0 | 1.2 | 1.2 | 0.9 | ||
| 1983 | 0.0 | 0.0 | 0.0 | 0.1 | 0.4 | 0.2 | 0.0 | 0.0 | 0.0 | - | 0.0 | 0.0 | 0.0 | 0.2 | 0.1 | 0.0 | 0.1 | ||
| 1982 | - | 0.0 | - | 0.0 | 0.0 | 0.0 | - | 0.0 | - | 0.0 | - | 0.0 | 0.0 | 0.0 | 0.0 | 0.0 | 0.0 | ||
Reporting rates
Reporting rate is the proportion of all surveys in which the species was present.
Reporting rate by year
This chart shows the reporting rate of European Goldfinch each year between 1982 and 2017. 
Reporting rate by month
This chart shows the reporting rate by month of European Goldfinch. The blue lines show the reporting rate for the twelve months to June 2017 and the bars show the average reporting rate for the period 1982 to 2017. 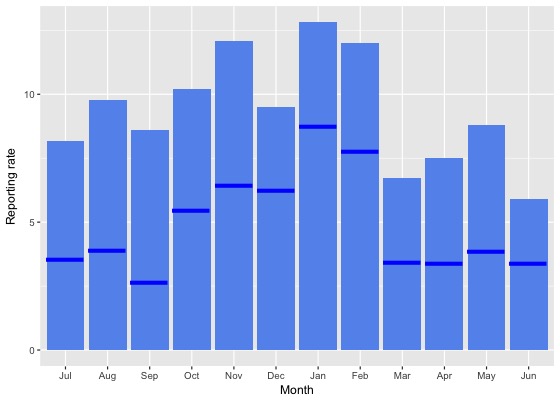
Reporting rate by season
This chart shows the seasonal reporting rate of European Goldfinch. The blue lines show the seasonal reporting rate for the twelve months to June 2017 and the bars show the average seasonal reporting rate for the period 1982 to 2017. 
Reporting rate data
| Month | Season | ||||||||||||||||||
|---|---|---|---|---|---|---|---|---|---|---|---|---|---|---|---|---|---|---|---|
| Period | Jul | Aug | Sep | Oct | Nov | Dec | Jan | Feb | Mar | Apr | May | Jun | Winter | Spring | Summer | Autumn | All | ||
| All years | |||||||||||||||||||
| All | 8.2 | 9.8 | 8.6 | 10.2 | 12.1 | 9.5 | 12.8 | 12.0 | 6.7 | 7.5 | 8.8 | 5.9 | 7.7 | 10.2 | 11.4 | 7.5 | 9.4 | ||
| Previous years | |||||||||||||||||||
| All previous years | 8.9 | 10.9 | 9.4 | 10.8 | 13.0 | 10.0 | 13.6 | 12.9 | 7.3 | 8.2 | 10.0 | 6.4 | 8.5 | 11.0 | 12.1 | 8.3 | 10.1 | ||
| Previous 30 years | 8.7 | 10.6 | 9.0 | 10.6 | 12.5 | 9.6 | 13.3 | 12.6 | 7.2 | 7.8 | 9.6 | 6.3 | 8.3 | 10.6 | 11.8 | 8.0 | 9.8 | ||
| Previous 20 years | 6.4 | 7.3 | 5.8 | 7.9 | 8.8 | 6.6 | 10.9 | 9.5 | 5.1 | 5.2 | 6.4 | 3.8 | 5.5 | 7.5 | 9.0 | 5.5 | 7.0 | ||
| 10 year groups | |||||||||||||||||||
| [2007,2017) | 7.1 | 7.7 | 6.1 | 7.8 | 10.0 | 7.7 | 11.4 | 9.9 | 5.5 | 5.6 | 7.1 | 4.7 | 6.2 | 7.8 | 9.7 | 5.9 | 7.6 | ||
| [1997,2007) | 5.1 | 6.4 | 5.2 | 8.4 | 6.4 | 4.7 | 9.4 | 8.4 | 4.1 | 4.3 | 4.7 | 2.0 | 4.1 | 6.7 | 7.1 | 4.3 | 5.6 | ||
| [1987,1997) | 17.0 | 20.8 | 25.5 | 25.8 | 24.6 | 25.9 | 27.2 | 27.2 | 18.7 | 21.1 | 21.8 | 18.6 | 18.9 | 25.3 | 26.8 | 20.5 | 23.0 | ||
| 5 year groups | |||||||||||||||||||
| [2012,2017) | 8.0 | 8.0 | 6.4 | 8.0 | 10.0 | 9.4 | 11.2 | 9.6 | 5.8 | 5.9 | 6.5 | 4.7 | 6.7 | 8.1 | 10.2 | 6.0 | 7.9 | ||
| [2007,2012) | 4.7 | 6.3 | 5.2 | 7.4 | 9.9 | 4.0 | 11.8 | 11.4 | 4.8 | 4.9 | 8.9 | 4.5 | 5.0 | 7.3 | 8.3 | 5.7 | 6.7 | ||
| [2002,2007) | 4.7 | 5.7 | 5.1 | 8.9 | 6.0 | 4.4 | 9.3 | 8.2 | 3.9 | 3.8 | 4.0 | 1.5 | 3.6 | 6.7 | 6.8 | 3.9 | 5.3 | ||
| [1997,2002) | 5.7 | 7.2 | 5.3 | 7.7 | 7.0 | 5.1 | 9.6 | 8.7 | 4.5 | 4.9 | 5.6 | 2.7 | 4.9 | 6.6 | 7.5 | 4.9 | 6.1 | ||
| [1992,1997) | 7.1 | 8.8 | 9.7 | 11.8 | 16.9 | 11.7 | 12.0 | 11.5 | 8.0 | 9.4 | 9.8 | 5.3 | 7.1 | 13.0 | 11.8 | 9.0 | 10.3 | ||
| [1987,1992) | 21.5 | 27.3 | 33.0 | 33.5 | 28.3 | 32.1 | 35.6 | 33.2 | 25.1 | 27.7 | 28.1 | 26.1 | 25.0 | 31.5 | 33.6 | 26.9 | 29.4 | ||
| Year | |||||||||||||||||||
| 2017 | 3.5 | 3.9 | 2.6 | 5.5 | 6.4 | 6.2 | 8.7 | 7.8 | 3.4 | 3.4 | 3.9 | 3.4 | 3.6 | 4.9 | 7.7 | 3.6 | 5.0 | ||
| 2016 | 6.2 | 6.9 | 6.3 | 6.5 | 8.2 | 7.1 | 8.7 | 8.2 | 4.9 | 4.9 | 5.1 | 3.8 | 5.7 | 6.9 | 8.1 | 5.0 | 6.5 | ||
| 2015 | 8.2 | 6.7 | 6.8 | 8.2 | 8.1 | 9.4 | 8.4 | 8.9 | 5.6 | 5.2 | 4.8 | 4.4 | 6.1 | 7.7 | 8.9 | 5.3 | 7.1 | ||
| 2014 | 11.5 | 10.1 | 5.5 | 8.9 | 12.2 | 15.9 | 17.4 | 13.3 | 7.3 | 5.6 | 9.2 | 7.6 | 9.2 | 8.6 | 15.9 | 7.2 | 10.5 | ||
| 2013 | 5.9 | 8.1 | 4.3 | 7.6 | 12.1 | 11.2 | 14.8 | 9.4 | 5.1 | 9.5 | 13.0 | 5.8 | 6.5 | 7.9 | 12.1 | 8.3 | 9.1 | ||
| 2012 | 11.5 | 12.2 | 9.0 | 10.1 | 13.7 | 6.7 | 10.1 | 12.2 | 8.3 | 6.3 | 5.3 | 3.3 | 8.5 | 10.7 | 9.4 | 6.9 | 9.2 | ||
| 2011 | 4.1 | 4.0 | 7.0 | 6.1 | 10.3 | 4.5 | 12.4 | 16.9 | 6.9 | 5.6 | 10.2 | 4.9 | 4.6 | 7.1 | 10.5 | 7.4 | 7.7 | ||
| 2010 | 8.3 | 6.1 | 7.9 | 9.3 | 7.7 | 6.9 | 14.5 | 11.8 | 2.8 | 5.5 | 8.8 | 1.9 | 4.2 | 8.5 | 10.4 | 4.9 | 7.3 | ||
| 2009 | 2.9 | 11.5 | 6.0 | 5.9 | 9.4 | 2.6 | 10.7 | 8.3 | 5.1 | 5.3 | 7.6 | 1.8 | 4.2 | 6.7 | 6.8 | 5.8 | 6.0 | ||
| 2008 | 4.1 | 5.2 | 3.0 | 6.2 | 8.1 | 2.7 | 10.3 | 8.3 | 3.8 | 2.8 | 3.6 | 1.9 | 3.4 | 5.6 | 6.1 | 3.2 | 4.7 | ||
| 2007 | 5.5 | 5.6 | 2.1 | 10.6 | 15.5 | 2.7 | 10.2 | 7.0 | 4.7 | 5.6 | 12.2 | 10.1 | 8.3 | 9.0 | 6.3 | 6.6 | 7.6 | ||
| 2006 | 5.9 | 6.8 | 3.1 | 6.6 | 3.0 | 3.9 | 15.2 | 13.3 | 6.2 | 3.2 | 3.6 | 1.5 | 3.9 | 4.8 | 10.6 | 4.8 | 5.8 | ||
| 2005 | 5.9 | 6.5 | 3.0 | 6.1 | 4.8 | 4.0 | 8.5 | 7.6 | 4.3 | 4.9 | 4.0 | 1.5 | 3.8 | 4.4 | 6.0 | 4.4 | 4.6 | ||
| 2004 | 2.4 | 1.3 | 5.3 | 9.3 | 5.2 | 2.3 | 6.1 | 12.1 | 2.6 | 3.8 | 2.9 | 3.1 | 2.3 | 6.5 | 5.6 | 3.1 | 4.4 | ||
| 2003 | 7.7 | 5.0 | 8.1 | 8.8 | 7.3 | 6.4 | 3.7 | 3.3 | 2.2 | 3.2 | 3.1 | 1.2 | 4.3 | 8.0 | 4.7 | 2.8 | 5.1 | ||
| 2002 | 4.0 | 10.2 | 6.5 | 14.6 | 8.5 | 5.0 | 11.3 | 7.2 | 2.7 | 4.2 | 7.1 | 0.5 | 4.2 | 10.1 | 7.1 | 4.0 | 6.7 | ||
| 2001 | 6.2 | 6.0 | 5.6 | 9.2 | 9.1 | 6.9 | 8.5 | 9.3 | 4.5 | 6.3 | 5.2 | 2.0 | 4.7 | 7.6 | 8.1 | 5.2 | 6.5 | ||
| 2000 | 8.7 | 7.8 | 4.2 | 6.2 | 8.3 | 3.0 | 10.7 | 6.2 | 4.5 | 4.4 | 6.4 | 2.2 | 5.8 | 6.2 | 6.4 | 4.8 | 5.9 | ||
| 1999 | 5.9 | 8.2 | 4.6 | 10.7 | 4.5 | 6.2 | 8.0 | 8.6 | 3.8 | 5.7 | 6.2 | 4.7 | 5.8 | 6.6 | 7.6 | 5.2 | 6.2 | ||
| 1998 | 2.7 | 11.3 | 8.1 | 4.3 | 4.4 | 3.8 | 11.8 | 11.3 | 3.2 | 5.1 | 3.7 | 1.3 | 4.8 | 5.8 | 7.9 | 3.8 | 5.8 | ||
| 1997 | 1.1 | 3.4 | 4.5 | 5.3 | 6.8 | 5.8 | 9.8 | 14.0 | 10.0 | 1.8 | 4.4 | 1.4 | 1.8 | 5.6 | 9.0 | 4.1 | 5.2 | ||
| 1996 | 6.0 | 5.3 | 1.3 | 8.8 | 6.5 | 8.1 | 5.8 | 8.2 | 2.9 | 9.4 | 8.6 | 3.4 | 4.8 | 6.1 | 7.3 | 6.2 | 6.2 | ||
| 1995 | 5.4 | 4.7 | 5.8 | 8.5 | 8.2 | 11.5 | 14.2 | 9.5 | 5.1 | 7.3 | 10.4 | 5.3 | 5.1 | 7.7 | 12.2 | 7.4 | 7.9 | ||
| 1994 | 11.8 | 13.0 | 14.7 | 9.3 | 21.3 | 15.2 | 11.8 | 12.1 | 6.8 | 9.2 | 7.5 | 6.7 | 10.1 | 16.2 | 12.8 | 8.0 | 11.8 | ||
| 1993 | 6.1 | 16.7 | 6.5 | 20.0 | 30.3 | 13.0 | 14.3 | 9.4 | 12.3 | 10.0 | 10.4 | 7.2 | 10.7 | 19.2 | 12.6 | 11.0 | 13.4 | ||
| 1992 | 7.7 | 7.4 | 20.0 | 17.0 | 25.0 | 14.3 | 17.2 | 22.0 | 15.5 | 13.6 | 11.8 | 3.3 | 6.1 | 20.3 | 17.3 | 13.6 | 14.8 | ||
| 1991 | 8.7 | 11.7 | 14.0 | 22.3 | 21.6 | 12.2 | 23.2 | 16.0 | 14.3 | 20.3 | 23.0 | 20.0 | 11.8 | 19.6 | 16.7 | 19.1 | 16.6 | ||
| 1990 | 23.9 | 27.6 | 29.0 | 19.4 | 26.2 | 31.9 | 33.3 | 35.2 | 27.3 | 23.8 | 27.4 | 21.1 | 25.0 | 24.8 | 33.5 | 26.1 | 26.7 | ||
| 1989 | 24.5 | 30.2 | 34.1 | 40.4 | 31.8 | 34.8 | 41.0 | 39.2 | 28.3 | 30.3 | 30.9 | 34.5 | 29.5 | 35.8 | 38.1 | 29.8 | 33.5 | ||
| 1988 | 23.7 | 30.2 | 42.1 | 32.8 | 30.1 | 32.3 | 30.7 | 35.4 | 24.8 | 33.7 | 29.8 | 29.5 | 27.9 | 34.0 | 32.7 | 29.3 | 31.0 | ||
| 1987 | 36.4 | 26.7 | 33.6 | 37.1 | 27.2 | 36.0 | 40.0 | 29.6 | 24.9 | 24.3 | 26.2 | 19.1 | 20.4 | 32.1 | 34.8 | 25.1 | 29.7 | ||
| 1986 | 11.5 | 47.4 | 62.3 | 58.3 | 61.7 | 44.1 | 52.2 | 52.8 | 22.6 | 51.0 | 31.0 | 34.3 | 33.3 | 61.0 | 49.5 | 37.8 | 46.5 | ||
| 1985 | 30.0 | 23.3 | 25.0 | 26.7 | 31.6 | 45.0 | 37.5 | 35.3 | 0.0 | 21.1 | 40.0 | 10.7 | 21.6 | 27.7 | 42.4 | 20.0 | 28.7 | ||
| 1984 | 0.0 | 0.0 | 0.0 | 0.0 | 0.0 | 0.0 | 44.8 | 18.2 | 33.3 | 14.7 | 38.7 | 8.8 | 6.1 | 0.0 | 25.7 | 28.3 | 20.3 | ||
| 1983 | 0.0 | 0.0 | 0.0 | 7.7 | 44.4 | 15.4 | 0.0 | 0.0 | 0.0 | - | 0.0 | 0.0 | 0.0 | 18.5 | 6.7 | 0.0 | 7.0 | ||
| 1982 | - | 0.0 | - | 0.0 | 0.0 | 0.0 | - | 0.0 | - | 0.0 | - | 0.0 | 0.0 | 0.0 | 0.0 | 0.0 | 0.0 | ||
Breeding data
Breeding records by month
Number of breeding records by breeding code and month, 2017 and all years| Breeding code | Jul | Aug | Sep | Oct | Nov | Dec | Jan | Feb | Mar | Apr | May | Jun |
|---|---|---|---|---|---|---|---|---|---|---|---|---|
| 2017 | ||||||||||||
| Breeding (BLA code) | 0 | 0 | 0 | 0 | 0 | 0 | 0 | 1 | 0 | 0 | 0 | 0 |
| Carrying Food | 0 | 0 | 0 | 0 | 0 | 0 | 0 | 0 | 0 | 0 | 0 | 0 |
| Copulating | 0 | 0 | 0 | 0 | 0 | 0 | 0 | 0 | 0 | 0 | 0 | 0 |
| Display | 0 | 0 | 0 | 0 | 0 | 0 | 0 | 0 | 0 | 0 | 0 | 0 |
| Dependent young | 0 | 0 | 0 | 0 | 0 | 0 | 1 | 0 | 0 | 0 | 0 | 0 |
| Faecal sac | 0 | 0 | 0 | 0 | 0 | 0 | 0 | 0 | 0 | 0 | 0 | 0 |
| Inspecting hollow | 0 | 0 | 0 | 0 | 0 | 0 | 0 | 0 | 0 | 0 | 0 | 0 |
| Nest building | 0 | 0 | 0 | 0 | 0 | 0 | 0 | 0 | 0 | 0 | 0 | 0 |
| Nest with eggs | 0 | 0 | 0 | 0 | 0 | 0 | 0 | 0 | 0 | 0 | 0 | 0 |
| Nest with young | 0 | 0 | 0 | 0 | 0 | 0 | 0 | 0 | 0 | 0 | 0 | 0 |
| On/leaving nest | 0 | 0 | 0 | 0 | 0 | 0 | 0 | 0 | 0 | 0 | 0 | 0 |
| All years | ||||||||||||
| Breeding (BLA code) | 0 | 0 | 0 | 1 | 1 | 0 | 1 | 1 | 0 | 0 | 0 | 0 |
| Carrying Food | 0 | 0 | 0 | 0 | 1 | 1 | 0 | 0 | 0 | 0 | 0 | 0 |
| Copulating | 0 | 0 | 0 | 0 | 0 | 0 | 0 | 0 | 0 | 0 | 0 | 0 |
| Display | 0 | 0 | 0 | 0 | 0 | 0 | 0 | 0 | 0 | 1 | 0 | 0 |
| Dependent young | 0 | 0 | 0 | 1 | 7 | 16 | 30 | 9 | 3 | 0 | 0 | 0 |
| Faecal sac | 0 | 0 | 0 | 0 | 0 | 0 | 0 | 0 | 0 | 0 | 0 | 0 |
| Inspecting hollow | 0 | 0 | 0 | 0 | 0 | 0 | 0 | 0 | 0 | 0 | 0 | 0 |
| Nest building | 0 | 0 | 0 | 8 | 3 | 4 | 5 | 0 | 0 | 0 | 0 | 0 |
| Nest with eggs | 0 | 0 | 0 | 0 | 0 | 1 | 0 | 0 | 0 | 0 | 0 | 0 |
| Nest with young | 0 | 0 | 0 | 0 | 1 | 2 | 0 | 0 | 0 | 0 | 0 | 0 |
| On/leaving nest | 0 | 0 | 0 | 0 | 0 | 1 | 0 | 0 | 0 | 0 | 0 | 0 |
Breeding records by year
Average number of breeding records per period by breeding code| Period | Breeding (BLA code) | Carrying Food | Copulating | Display | Dependent young | Faecal sac | Inspecting hollow | Nest building | Nest with eggs | Nest with young | On/leaving nest |
|---|---|---|---|---|---|---|---|---|---|---|---|
| All years | |||||||||||
| All | 0.1 | 0.1 | 0.0 | 0.0 | 1.8 | 0.0 | 0.0 | 0.6 | 0.0 | 0.1 | 0.0 |
| Previous years | |||||||||||
| All previous years | 0.1 | 0.1 | 0.0 | 0.0 | 1.9 | 0.0 | 0.0 | 0.6 | 0.0 | 0.1 | 0.0 |
| Previous 30 years | 0.1 | 0.1 | 0.0 | 0.0 | 2.2 | 0.0 | 0.0 | 0.6 | 0.0 | 0.1 | 0.0 |
| Previous 20 years | 0.1 | 0.0 | 0.0 | 0.0 | 1.3 | 0.0 | 0.0 | 0.1 | 0.0 | 0.0 | 0.0 |
| 10 year groups | |||||||||||
| [2007,2017) | 0.3 | 0.0 | 0.0 | 0.1 | 2.1 | 0.0 | 0.0 | 0.2 | 0.0 | 0.0 | 0.0 |
| [1997,2007) | 0.0 | 0.0 | 0.0 | 0.0 | 0.5 | 0.0 | 0.0 | 0.1 | 0.0 | 0.0 | 0.0 |
| [1987,1997) | 0.0 | 0.2 | 0.0 | 0.0 | 3.9 | 0.0 | 0.0 | 1.4 | 0.1 | 0.3 | 0.0 |
| 5 year groups | |||||||||||
| [2012,2017) | 0.0 | 0.0 | 0.0 | 0.0 | 3.2 | 0.0 | 0.0 | 0.2 | 0.0 | 0.0 | 0.0 |
| [2007,2012) | 0.6 | 0.0 | 0.0 | 0.2 | 1.0 | 0.0 | 0.0 | 0.2 | 0.0 | 0.0 | 0.0 |
| [2002,2007) | 0.0 | 0.0 | 0.0 | 0.0 | 0.6 | 0.0 | 0.0 | 0.2 | 0.0 | 0.0 | 0.0 |
| [1997,2002) | 0.0 | 0.0 | 0.0 | 0.0 | 0.4 | 0.0 | 0.0 | 0.0 | 0.0 | 0.0 | 0.0 |
| [1992,1997) | 0.0 | 0.0 | 0.0 | 0.0 | 1.2 | 0.0 | 0.0 | 0.0 | 0.0 | 0.0 | 0.0 |
| [1987,1992) | 0.0 | 0.4 | 0.0 | 0.0 | 6.6 | 0.0 | 0.0 | 2.8 | 0.2 | 0.6 | 0.0 |
| Year | |||||||||||
| 2017 | 1.0 | 0.0 | 0.0 | 0.0 | 1.0 | 0.0 | 0.0 | 0.0 | 0.0 | 0.0 | 0.0 |
| 2016 | 0.0 | 0.0 | 0.0 | 0.0 | 2.0 | 0.0 | 0.0 | 0.0 | 0.0 | 0.0 | 0.0 |
| 2015 | 0.0 | 0.0 | 0.0 | 0.0 | 3.0 | 0.0 | 0.0 | 1.0 | 0.0 | 0.0 | 0.0 |
| 2014 | 0.0 | 0.0 | 0.0 | 0.0 | 4.0 | 0.0 | 0.0 | 0.0 | 0.0 | 0.0 | 0.0 |
| 2013 | 0.0 | 0.0 | 0.0 | 0.0 | 1.0 | 0.0 | 0.0 | 0.0 | 0.0 | 0.0 | 0.0 |
| 2012 | 0.0 | 0.0 | 0.0 | 0.0 | 6.0 | 0.0 | 0.0 | 0.0 | 0.0 | 0.0 | 0.0 |
| 2011 | 0.0 | 0.0 | 0.0 | 0.0 | 2.0 | 0.0 | 0.0 | 0.0 | 0.0 | 0.0 | 0.0 |
| 2010 | 2.0 | 0.0 | 0.0 | 0.0 | 2.0 | 0.0 | 0.0 | 1.0 | 0.0 | 0.0 | 0.0 |
| 2009 | 1.0 | 0.0 | 0.0 | 1.0 | 0.0 | 0.0 | 0.0 | 0.0 | 0.0 | 0.0 | 0.0 |
| 2008 | 0.0 | 0.0 | 0.0 | 0.0 | 0.0 | 0.0 | 0.0 | 0.0 | 0.0 | 0.0 | 0.0 |
| 2007 | 0.0 | 0.0 | 0.0 | 0.0 | 1.0 | 0.0 | 0.0 | 0.0 | 0.0 | 0.0 | 0.0 |
| 2006 | 0.0 | 0.0 | 0.0 | 0.0 | 1.0 | 0.0 | 0.0 | 0.0 | 0.0 | 0.0 | 0.0 |
| 2005 | 0.0 | 0.0 | 0.0 | 0.0 | 0.0 | 0.0 | 0.0 | 1.0 | 0.0 | 0.0 | 0.0 |
| 2004 | 0.0 | 0.0 | 0.0 | 0.0 | 1.0 | 0.0 | 0.0 | 0.0 | 0.0 | 0.0 | 0.0 |
| 2003 | 0.0 | 0.0 | 0.0 | 0.0 | 0.0 | 0.0 | 0.0 | 0.0 | 0.0 | 0.0 | 0.0 |
| 2002 | 0.0 | 0.0 | 0.0 | 0.0 | 1.0 | 0.0 | 0.0 | 0.0 | 0.0 | 0.0 | 0.0 |
| 2001 | 0.0 | 0.0 | 0.0 | 0.0 | 0.0 | 0.0 | 0.0 | 0.0 | 0.0 | 0.0 | 0.0 |
| 2000 | 0.0 | 0.0 | 0.0 | 0.0 | 1.0 | 0.0 | 0.0 | 0.0 | 0.0 | 0.0 | 0.0 |
| 1999 | 0.0 | 0.0 | 0.0 | 0.0 | 1.0 | 0.0 | 0.0 | 0.0 | 0.0 | 0.0 | 0.0 |
| 1998 | 0.0 | 0.0 | 0.0 | 0.0 | 0.0 | 0.0 | 0.0 | 0.0 | 0.0 | 0.0 | 0.0 |
| 1997 | 0.0 | 0.0 | 0.0 | 0.0 | 0.0 | 0.0 | 0.0 | 0.0 | 0.0 | 0.0 | 0.0 |
| 1996 | 0.0 | 0.0 | 0.0 | 0.0 | 1.0 | 0.0 | 0.0 | 0.0 | 0.0 | 0.0 | 0.0 |
| 1995 | 0.0 | 0.0 | 0.0 | 0.0 | 3.0 | 0.0 | 0.0 | 0.0 | 0.0 | 0.0 | 0.0 |
| 1994 | 0.0 | 0.0 | 0.0 | 0.0 | 2.0 | 0.0 | 0.0 | 0.0 | 0.0 | 0.0 | 0.0 |
| 1993 | 0.0 | 0.0 | 0.0 | 0.0 | 0.0 | 0.0 | 0.0 | 0.0 | 0.0 | 0.0 | 0.0 |
| 1992 | 0.0 | 0.0 | 0.0 | 0.0 | 0.0 | 0.0 | 0.0 | 0.0 | 0.0 | 0.0 | 0.0 |
| 1991 | 0.0 | 1.0 | 0.0 | 0.0 | 0.0 | 0.0 | 0.0 | 0.0 | 0.0 | 0.0 | 0.0 |
| 1990 | 0.0 | 0.0 | 0.0 | 0.0 | 1.0 | 0.0 | 0.0 | 0.0 | 0.0 | 0.0 | 0.0 |
| 1989 | 0.0 | 1.0 | 0.0 | 0.0 | 14.0 | 0.0 | 0.0 | 5.0 | 1.0 | 1.0 | 0.0 |
| 1988 | 0.0 | 0.0 | 0.0 | 0.0 | 9.0 | 0.0 | 0.0 | 2.0 | 0.0 | 2.0 | 0.0 |
| 1987 | 0.0 | 0.0 | 0.0 | 0.0 | 9.0 | 0.0 | 0.0 | 7.0 | 0.0 | 0.0 | 0.0 |
| 1986 | 0.0 | 0.0 | 0.0 | 0.0 | 0.0 | 0.0 | 0.0 | 2.0 | 0.0 | 0.0 | 0.0 |
| 1985 | 0.0 | 0.0 | 0.0 | 0.0 | 0.0 | 0.0 | 0.0 | 1.0 | 0.0 | 0.0 | 1.0 |
| 1984 | 0.0 | 0.0 | 0.0 | 0.0 | 0.0 | 0.0 | 0.0 | 0.0 | 0.0 | 0.0 | 0.0 |
| 1983 | 0.0 | 0.0 | 0.0 | 0.0 | 0.0 | 0.0 | 0.0 | 0.0 | 0.0 | 0.0 | 0.0 |
| 1982 | 0.0 | 0.0 | 0.0 | 0.0 | 0.0 | 0.0 | 0.0 | 0.0 | 0.0 | 0.0 | 0.0 |
Distribution map
Distribution - 2017
This map shows the observed distribution of the European Goldfinch for 2017.
The red circles are the grid cells where European Goldfinch have been reported.
The transparency of the red circles indicate how many surveys sheets were submitted for that grid cell; the darker the red the more reliable the data. Of the 315 grid cells with reports, 83 had only one sheet; an example is grid number A21.
The size of the circle represents the reporting rate. The maximum reporting rate for European Goldfinch was 100.0% (eg grid number A21) and the minimum was 0.2% (eg grid number J12). 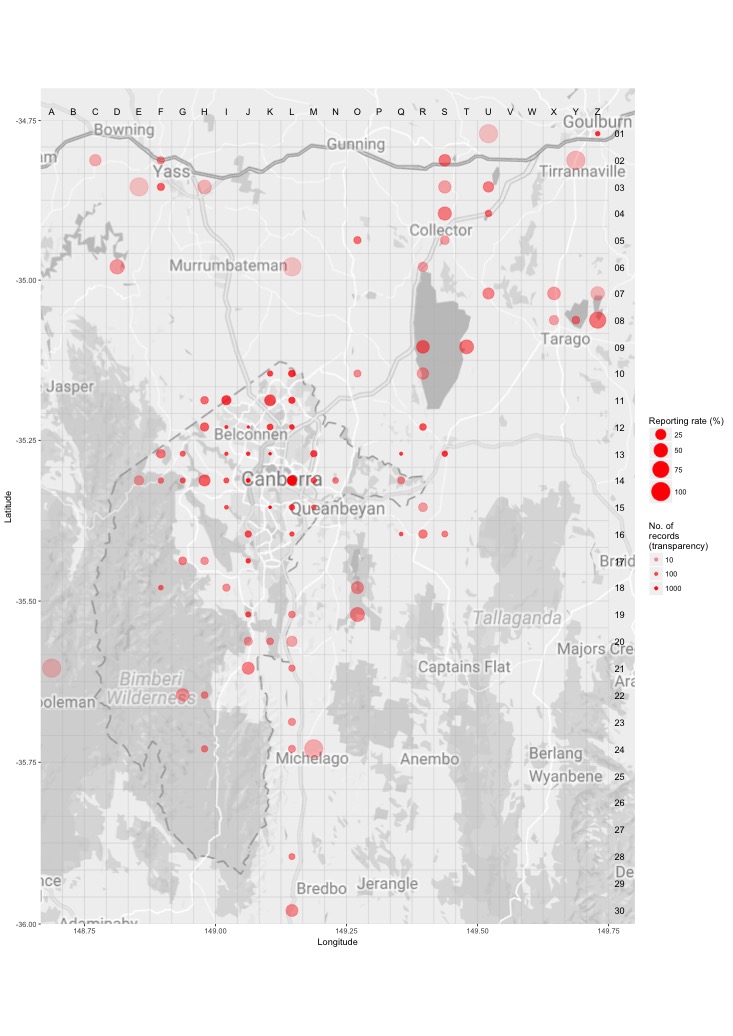
Distribution - all years
This map shows the observed distribution of the European Goldfinch for all years.
The red circles are the grid cells where European Goldfinch have been reported.
The transparency of the red circles indicate how many surveys sheets were submitted for that grid cell; the darker the red the more reliable the data. Of the 703 grid cells with reports, 55 had only one sheet; an example is grid number A12.
The size of the circle represents the reporting rate. The maximum reporting rate for European Goldfinch was 80.0% (eg grid number E30) and the minimum was 0.4% (eg grid number D16). 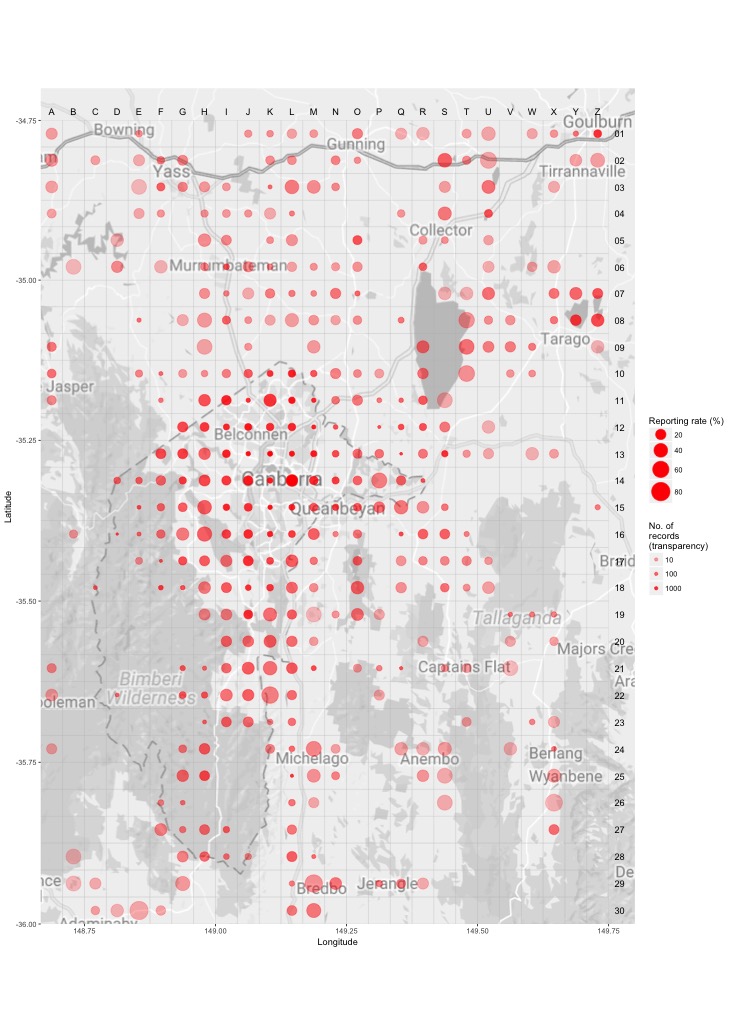
Breeding map
Breeding - 2017
This map shows the breeding distribution of the European Goldfinch for 2017.
The red circles are the grid cells where breeding activity for European Goldfinch have been reported.
The size of the circle represents the number of reports. 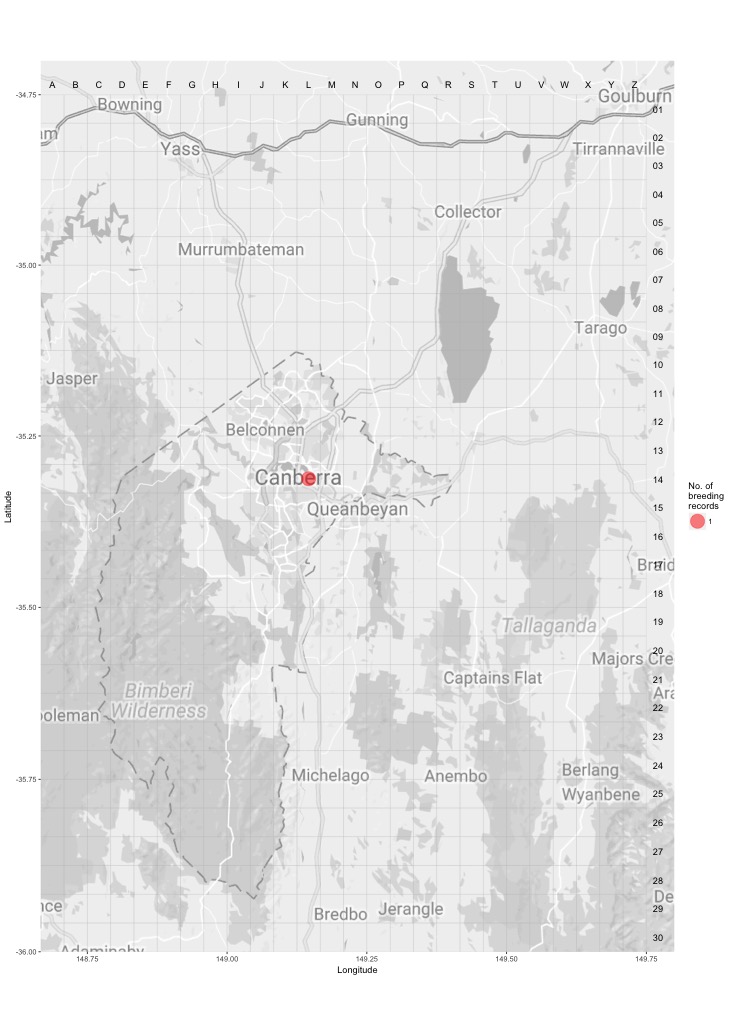
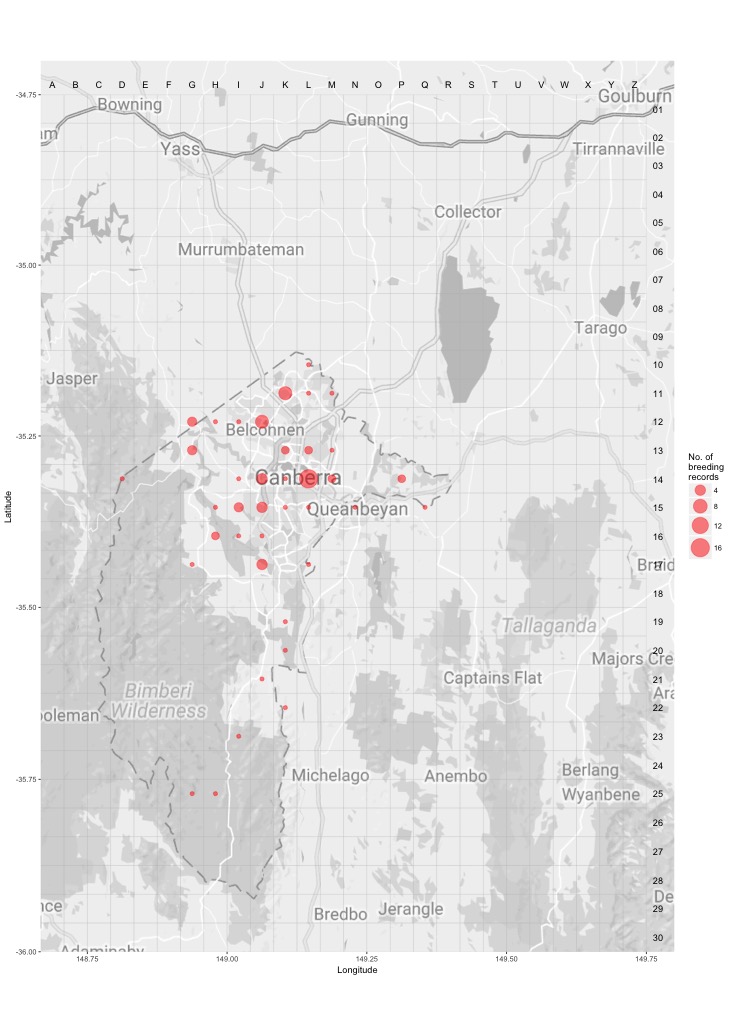
Breeding - all years
This map shows the breeding distribution of the European Goldfinch for all years.
The red circles are the grid cells where breeding activity for European Goldfinch have been reported.
The size of the circle represents the number of reports.